Thomas Funk, Investment Director, portfolio manager of Swiss Equities, analyses whether the structural growth of Swiss companies in the coming years will also be reflected in an increase in Swiss franc profits, despite the real appreciation of the franc.
07 February 2024
In recent years, I have occasionally been asked by clients about the role of the Swiss franc in our strategies and its influence on the profits of Swiss companies.
Profits are always influenced by very different factors. The following statements reflect my views on the profit trend of the Swiss stock exchange over various periods are intended to be understood as a tendency. Overall, the figures indicate that there are phases in which the Swiss franc helps earnings momentum, others in which it hinders it and others again in which the effect is more or less neutral.
Inflation must be taken into account
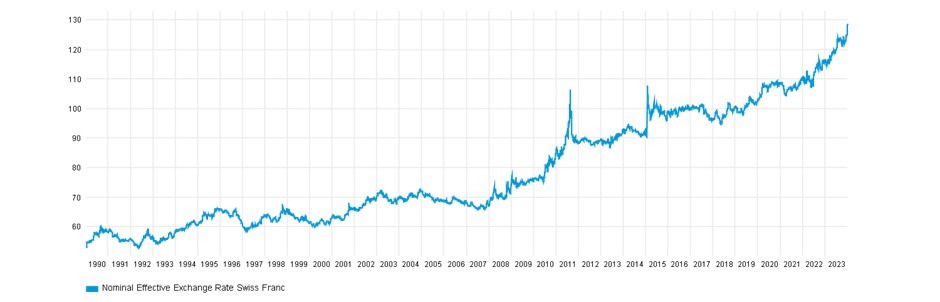
Last year, the Swiss franc once again appreciated sharply and weighed on the profits of internationally active Swiss companies. On a trade-weighted basis, the currency gained +10.4%. To illustrate the development of the trade-weighted Swiss franc, I will use the Citigroup data series ‘Citi broad nominal effective exchange rate index – CHF’, among others. I have used data going back to the early 1990s to make it comparable with our calculations for the earnings development of the Swiss equity market.
As many Swiss companies earn a large proportion of their profits abroad, the development of the Swiss franc has a direct impact on the profit of listed companies in Switzerland. Profits generated abroad must be converted into Swiss francs. If the Swiss franc appreciates, profits in Swiss francs decrease; if it depreciates, profits increase in terms of Swiss francs. However, analysis shows that this simple rule falls short because it does not take inflation into account.
Chart 1: Nominal trade-weighted Swiss franc1
From 1 Jan 1990 to 29 Dec 2023
Past performance is not an indicator of future performance and current or future trends.
Source: Bloomberg, as at 29 December 2023.
Source: Bloomberg, as at 29 December 2023.
Since the beginning of the 1990s, ie 33 years ago, the Swiss franc has gone through various phases. Chart 1 illustrates the development of the trade-weighted Swiss franc. From 1990 to 2007, it appreciated at a moderate pace. Then the global financial crisis broke out in the second half of 2007, followed by the euro crisis. The appreciation accelerated in 2008 and in 2011 the flight into the Swiss franc became so strong that the Swiss National Bank (SNB) introduced a cap against the euro, which stopped the appreciation. As a result, the Swiss currency moved sideways until the beginning of 2015. In January 2015, the SNB lifted the cap and switched to a ‘dirty float’. This means that the SNB acts in the currency market in order to achieve its inflation target. Market participants are left in the dark as to where the intervention limits lie. When the SNB lifted the cap at the beginning of 2015, the Swiss franc experienced a brief, shock-like appreciation, but the situation later calmed down and a sideways movement became established, which lasted until the end of 2019. From then on, the Swiss franc appreciated again at an accelerated pace.
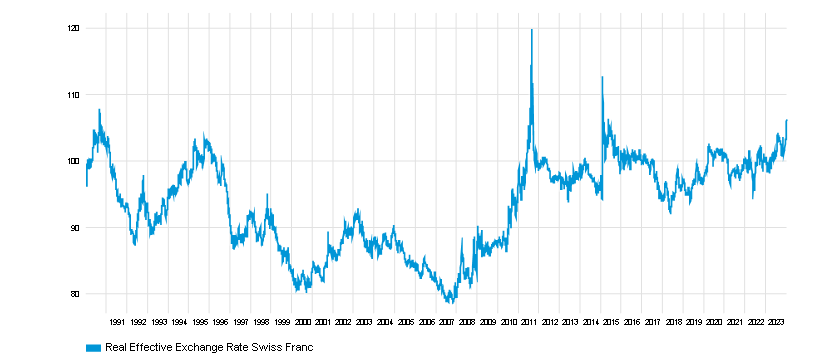
However, the nominal trade-weighted franc in Chart 1 provides an incomplete picture of currency developments. The real trade-weighted franc includes the inflation rates of the various currencies in the currency basket on which the calculations are based. We use the Citigroup data series ‘Citi broad real effective exchange rate index – CHF’ for this purpose. It is based on the same currency basket as the nominal version, but takes into account the respective inflation of the currencies in the currency basket. We can see the development in Chart 2.
Chart 2: Real trade-weighted Swiss franc2
From 1 Jan 1990 to 29 Dec 2023
Past performance is not an indicator of future performance and current or future trends.
Source: Bloomberg, as at 29 December 2023.
Source: Bloomberg, as at 29 December 2023.
Such a data series usually starts at 100 (or alternatively at 1). However because the calculations of the Citigroup data series go back further than 1990, the starting value in the chart is not exactly 100, but 97.4. The amazing thing is that while the nominal trade-weighted franc has appreciated by 140.9% since 1990, the real trade-weighted franc stands at 106.3 at the end of 2023 compared to 97.4 at the beginning of 1990. In other words, there has been almost no change.
Production costs comparable to 1990
This means that the nominal trade-weighted appreciation of the Swiss franc since 1990 can be explained almost exclusively by lower inflation in Switzerland compared to other countries. This also indicates that the production costs for Swiss companies relative to international competition are quite comparable with 1990. Production costs abroad are likely to have risen significantly more than in Switzerland due to higher inflation, measured in the respective national currencies. If exchange rates remained unchanged, the Swiss economy would therefore gain a clear export advantage over time. However, this was compensated for by the appreciation of the Swiss franc, so today, in relative terms, the cost side of production conditions should be similar to 1990. Then as now, however, Switzerland is a country with high wages. This demands high productivity from companies and makes it essential to focus on products with high value added. However, production conditions have changed repeatedly over the last 33 years.
What does this mean for Swiss companies operating internationally?
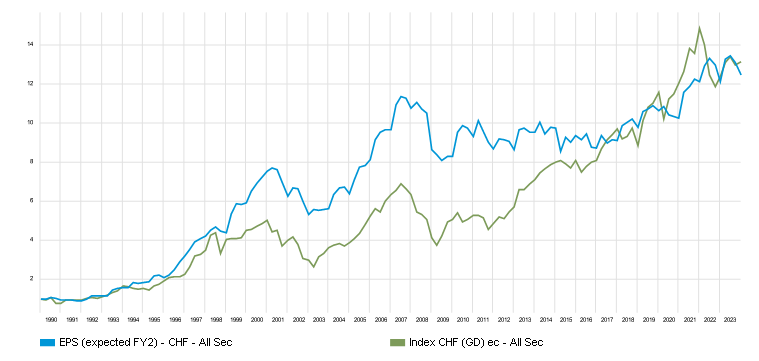
Prices abroad have tended to rise more sharply than the Swiss franc appreciated due to higher inflation. In addition, production conditions in Switzerland became increasingly attractive due to the relative devaluation of the Swiss franc. Profits were booming for companies listed on the Swiss stock exchange. Chart 3 shows an extremely dynamic profit trend for the period from 1995 to 2007. This was dominated above all by the large companies that have been active internationally for many years.
Chart 3: Swiss Performance Index gains (blue) compared with the index return (green)
From 29 Dec 1989 to 29 Dec 2023
Past performance is not an indicator of future performance and current or future trends.
Source: GAM Equity Analytics, Bloomberg as at 29 December 2023.
Source: GAM Equity Analytics, Bloomberg as at 29 December 2023.
Chart 3 illustrates the earnings per share of companies listed on the Swiss stock exchange. From 1990 to 2007, earnings per share increased more than 11-fold. Over the same period, the Swiss franc was on a down trend and was clearly undervalued at the end of 2007. In real terms (Chart 2), it had lost more than 20%. In nominal terms (Chart 1), it was also weakened from 2004 to 2007, this was the time of the carry trades. Currency speculators borrowed money at low Swiss interest rates and invested it in high-yielding currencies. This put pressure on the Swiss franc. I can well remember discussions in our team as to whether it would degenerate into a soft currency. In the short term, there seemed to be no way out of this carry trade situation, but the real trade-weighted franc had been pointing to an undervaluation of the Swiss currency for some time.
The global financial crisis then changed monetary conditions worldwide. Interest rates were reduced to zero or, as in Switzerland, to below zero. The central banks expanded the monetary base and the flight into the Swiss franc began. As a result, it appreciated massively, both in nominal and real terms. Inflation in Switzerland was very low, but rose somewhat in the eurozone and the US. This gave the appreciation additional momentum. However, most of the appreciation took place in real terms. In Switzerland, it choked off any profit momentum on the Swiss stock exchange. The economy groaned and many export-orientated companies were in the red because production costs in Switzerland rose within a short time span as a result of the currency appreciation. At this time, the SNB conducted regular surveys of the financial situation of Swiss companies and published them in its quarterly bulletin. These surveys not only covered listed companies, but also provided a broad picture of the situation of Swiss companies. The situation was tense. The Swiss franc went from being undervalued to being overvalued within a short time span. This was a major problem for many companies operating abroad. The SNB therefore introduced a cap on the euro, which it defended until the beginning of 2015. This brought the exchange rate to a level that allowed the economy to adjust. It is striking that the intervention brought the real trade-weighted Swiss franc exchange rate back close to 100 (Chart 2) and then into a range of 95 to 100, allowing Swiss companies to adapt to the new conditions. A jolt went through the companies and many underwent a true fitness cure. Although it was already known in 2007 that the Swiss franc was actually a hard currency and that continuous work on productivity was a must, it was only under the pressure of the revaluation that it became clear there was no way around it. The Swiss corporate landscape gradually became stronger. Costs were cut, new products developed and unprofitable lines of business abandoned. The SNB cap gave companies time and planning security to implement measures. The survey results in the SNB's quarterly reports improved. However, the cap was only a temporary solution, as inflation differentials were continuously moving in the direction of a stronger Swiss franc. In January 2015, the SNB took the bold decision to lift the cap, surprising everyone, including us. Since then, the real trade-weighted Swiss franc exchange rate has fluctuated between 95 and 105. At around 106.3 at the end of 2023, it was slightly above this range.
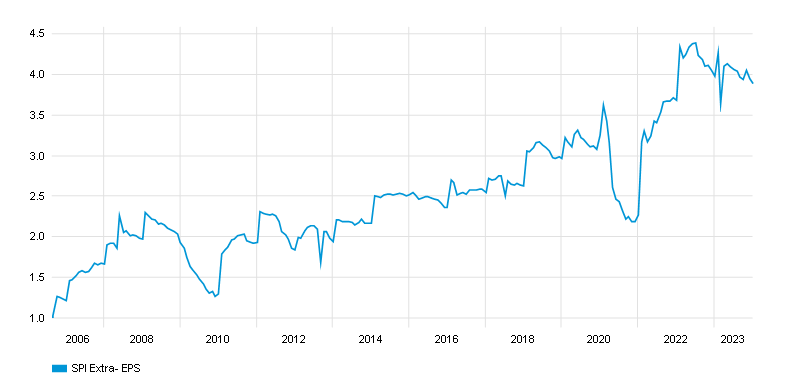
The lifting of the cap triggered another wave of adjustments in 2015. Small and mid-cap companies in particular took advantage of the better conditions that arose from 2016 and significantly increased their profits as a result (Chart 4). The nominal trade-weighted Swiss franc exchange rate was suddenly no longer the spoilsport it had been in previous years, but instead moved sideways from 2016 to the end of 2019, not least thanks to covert interventions by the SNB.
Chart 4: Profit development of small and mid-capitalisation companies (SPI Extra earnings per share)
From 19 Aug 2005 to 29 Dec Nov 2023
Past performance is not an indicator of future performance and current or future trends.
Source: Bloomberg as at 29 Dec 2023.
Source: Bloomberg as at 29 Dec 2023.
Recent appreciation driven by inflation
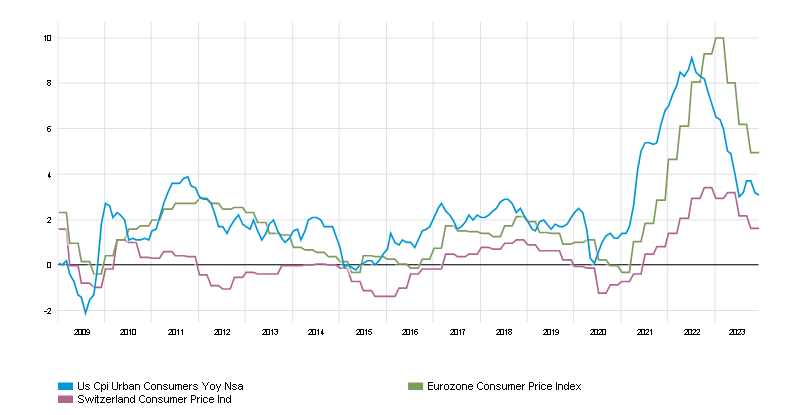
Chart 5 compares Switzerland's inflation rates with inflation in the eurozone and the US. From the end of 2008 to the beginning of 2021, inflation in Switzerland was close to zero. It was slightly higher for its main trading partners. In 2020, Covid-19 changed the economic environment again. Inflation shot up due to the disruptions in trade flows with Switzerland's largest trading partners (Europe, US). In Switzerland, the trend was more moderate. As a result, inflation differentials widened considerably. This created room for the latest wave of Swiss franc appreciation.
Chart 5: Consumer Price Index (CPI) in the US (blue), Switzerland (purple) and eurozone (green)
From 31 Dec 2008 to 30 Nov 2023
Past performance is not an indicator of future performance and current or future trends.
Source: Bloomberg, as at 30 November 2023.
Source: Bloomberg, as at 30 November 2023.
In 2021 particularly, but also in 2022, internationally active Swiss companies took advantage of the shortage of goods and increased their prices. This led to a good profit situation in 2021. Chart 4 clearly shows how profits at small and mid caps soared in 2021 and reached a new high. After that, the profit trend clouded over. Trade flows increasingly normalised, reducing the need to raise prices. At the same time, the SNB allowed the Swiss franc to appreciate more strongly. This dampened inflation in Switzerland and the SNB fulfilled its mandate to ensure stable prices. Companies now had to translate profits generated abroad at less favourable exchange rates, which weighed on profits calculated in Swiss francs. However, the situation today is fundamentally different from the wave of appreciation in 2010/11. It was not the higher inflation differentials that primarily led to an appreciation of the Swiss franc back then, but the adjustment of the real depreciation from 1995 to 2007. For competitive reasons, Swiss companies were unable to increase prices abroad at that time, even though the franc was strong. The adjustments had to be made through productivity gains and innovations. The inflationary surge caused by Covid-19 was a different story. Prices abroad rose across the board due to shortages. Swiss companies adjusted their prices in line with the general trend, but subsequently had to give back some of the price increases due to the higher inflation differentials and the associated appreciation of the Swiss franc. One advantage of the Swiss franc is that lower inflation has preserved the purchasing power of Swiss citizens better than for people in the eurozone or the US, even if wage increases abroad were more pronounced than in Switzerland.
What does this mean for the future?
An appreciation of the Swiss franc can always lead to a slowdown in profit growth for Swiss companies. During the appreciation in 2010/11 and when the cap was lifted in 2015, I seriously wondered whether it was worthwhile for Swiss companies to invest so heavily abroad. For years, the growth rates achieved abroad evaporated in the currency appreciation. At the time, I did not fully realise the effect of inflation differentials and the real undervaluation of the Swiss franc. This resulted in a difficult period for our strategy, as we invested heavily in internationally active Swiss companies. The situation is different now. The fitness programme following the global financial crisis has taught Swiss companies what they need to do. They have continued to work on productivity and innovation in order to gain competitiveness and market share. This should lead to dynamic profit growth as soon as an upturn starts to take hold. As the Swiss franc is rather overvalued compared to 2007, the scope for a painful real appreciation appears to be limited. If inflation continues to ease, the outlook should improve, allowing for an attractive development of Swiss franc profits.
In the long term, the nominal trade-weighted Swiss franc is likely to appreciate in line with inflation differentials against the currencies in the currency basket. This is suggested by the development of the real trade-weighted Swiss franc from 1990 to 2023, and also provides an answer to the question of whether it is worthwhile for Swiss companies to invest abroad. Most listed companies today no longer pursue a pure export model from Switzerland, but produce internationally. For example, they can increase prices more in a currency area with higher inflation rates than in Switzerland, but lose this additional income from price increases in the long term when the Swiss franc appreciates. As production costs usually rise faster in these countries, it is necessary to constantly work on productivity. Many Swiss companies have internalised this because they have developed from a country with a strong currency. By expanding geographically, they are expanding massively into new markets and earning more as a result. As the scope for a stronger real appreciation of the Swiss franc is limited, the structural growth of Swiss companies should also be reflected in an increase in Swiss franc profits over the next few years.
1 Nominal exchange rate: Nominal exchange rate is the price of one currency in terms of another. It is usually expressed as the domestic price of the foreign currency. If it costs a US dollar holder 1.36 dollars to buy one euro, from a euroholder’s perspective the nominal rate is 0.735 euros per dollar. (Source: International Monetary Fund)
2Real exchange rate: The real exchange rate (RER) between two currencies is the product of the nominal exchange rate (the dollar cost of a euro, for example) and the ratio of prices between the two countries. The core equation is RER = eP*/P, where, in our example, e is the nominal dollar/euro exchange rate, P* is the average price of a good in the euro area, and P is the average price of the good in the United States. In the Big Mac example, e = 1.36. If the German price is 2.5 euros and the US price is 3.40 dollars, then (1.36) X (2.5) ÷ 3.40 yields an RER of 1. But if the German price were 3 euros and the US price 3.40 dollars, the RER would be 1.36 X 3 ÷ 3.40, for an RER of 1.2. (Source: International Monetary Fund)
2Real exchange rate: The real exchange rate (RER) between two currencies is the product of the nominal exchange rate (the dollar cost of a euro, for example) and the ratio of prices between the two countries. The core equation is RER = eP*/P, where, in our example, e is the nominal dollar/euro exchange rate, P* is the average price of a good in the euro area, and P is the average price of the good in the United States. In the Big Mac example, e = 1.36. If the German price is 2.5 euros and the US price is 3.40 dollars, then (1.36) X (2.5) ÷ 3.40 yields an RER of 1. But if the German price were 3 euros and the US price 3.40 dollars, the RER would be 1.36 X 3 ÷ 3.40, for an RER of 1.2. (Source: International Monetary Fund)
Important disclosures and information
The information contained herein is given for information purposes only and does not qualify as investment advice. Opinions and assessments contained herein may change and reflect the point of view of GAM in the current economic environment. No liability shall be accepted for the accuracy and completeness of the information contained herein. Past performance is no indicator of current or future trends. The mentioned financial instruments are provided for illustrative purposes only and shall not be considered as a direct offering, investment recommendation or investment advice or an invitation to invest in any GAM product or strategy. Reference to a security is not a recommendation to buy or sell that security. The securities listed were selected from the universe of securities covered by the portfolio managers to assist the reader in better understanding the themes presented. The securities included are not necessarily held by any portfolio or represent any recommendations by the portfolio managers. Specific investments described herein do not represent all investment decisions made by the manager. The reader should not assume that investment decisions identified and discussed were or will be profitable. Specific investment advice references provided herein are for illustrative purposes only and are not necessarily representative of investments that will be made in the future. No guarantee or representation is made that investment objectives will be achieved. The value of investments may go down as well as up. Investors could lose some or all of their investments.
The foregoing views contains forward-looking statements relating to the objectives, opportunities, and the future performance of the markets generally. Forward-looking statements may be identified by the use of such words as; “believe,” “expect,” “anticipate,” “should,” “planned,” “estimated,” “potential” and other similar terms. Examples of forward-looking statements include, but are not limited to, estimates with respect to financial condition, results of operations, and success or lack of success of any particular investment strategy. All are subject to various factors, including, but not limited to general and local economic conditions, changing levels of competition within certain industries and markets, changes in interest rates, changes in legislation or regulation, and other economic, competitive, governmental, regulatory and technological factors affecting a portfolio’s operations that could cause actual results to differ materially from projected results. Such statements are forward-looking in nature and involve a number of known and unknown risks, uncertainties and other factors, and accordingly, actual results may differ materially from those reflected or contemplated in such forward-looking statements. Prospective investors are cautioned not to place undue reliance on any forward-looking statements or examples. None of GAM or any of its affiliates or principals nor any other individual or entity assumes any obligation to update any forward-looking statements as a result of new information, subsequent events or any other circumstances. All statements made herein speak only as of the date that they were made.