Hidden in plain sight for many investors, longer-dated US Treasury bonds may seem dull to some but now offer multiple opportunities. With valuations around their most attractive levels in recent years and increasingly competitive with equities, Julian Howard believes they are valuable portfolio diversifiers well-placed to capitalise when inflation and growth ultimately ease.
12 February 2024
James Carville, Bill Clinton’s campaign strategist, once famously said that he would like to return in another life as the bond market. Having imagined various reincarnation options, including the US President and the Pope, Carville plumped for the bond market on the basis that he would then have the power to “intimidate everybody”.
What may have seemed like an odd comment in fact makes sense when one considers the importance of the US Treasury bond markets. Since the yield on Treasuries effectively is the cost of global capital, it forms the basis for pricing all assets which generate a cashflow, including real estate, equities and indeed other bonds. Generally speaking, Treasury yields reflect the sum of long-term growth and inflation expectations, and so changes in these expectations affect them in turn. This gives them a generally steady quality, unless expectations change suddenly or there are worries about the US government’s ability to repay its debts, leading bondholders to demand a premium in terms of higher yield. For example, from 15 October 1993 to 4 November 1994 10-year US Treasury bonds sold off to the tune of -13.1% (source: GAM) as concerns mounted about Federal spending. Such was the extent of the ‘Great Bond Massacre’ that the Clinton administration and Congress were forced to make more visible efforts to contain the deficit. It was this ability to intimidate policymakers that Carville so admired. More recently the bond market has repeated history, only more so. From 30 July 2020 to 20 October 2023, US Treasury bond prices shed a remarkable -25.6% (source: GAM) amid higher post-pandemic inflation expectations as well as renewed government deficit concerns. While the two episodes demonstrate how US Treasuries can occasionally be volatile, they also show how such moments can present an opportunity to buy into an otherwise steady and useful asset class at more compelling valuations.
The valuation appeal of Treasuries
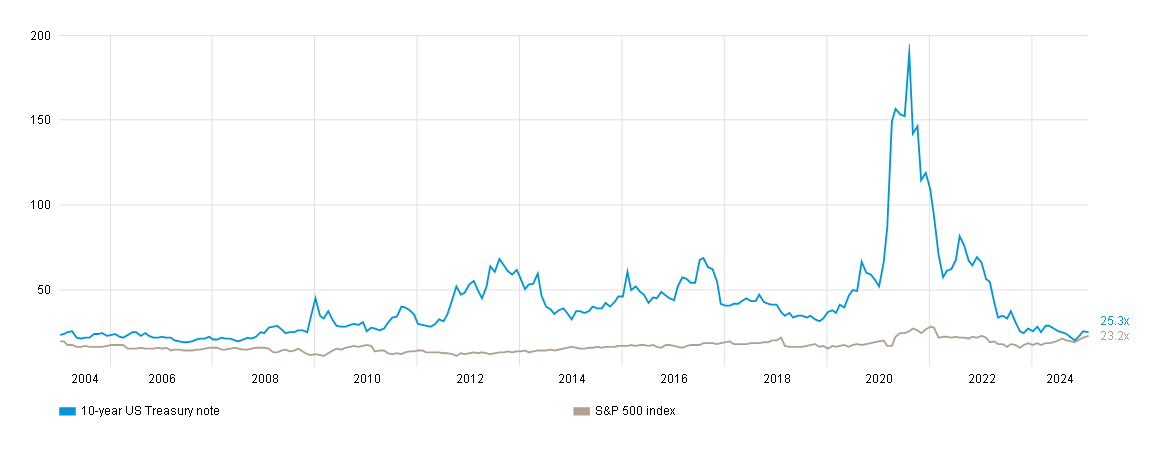
The good news for investors today is that yields on the 10-year US Treasury bond are still relatively elevated at just over 4.0% as at 31 January 2024, in our opinion offering a compelling moment to add or increase exposure within multi-asset portfolios. The first component to this opportunity is, as mentioned, valuation. US Treasuries are cheap relative to their recent history. Taking a stock market valuation approach in which the ‘price’ of the 10-year US Treasury bond is 100 and the ‘earnings’ is the current yield to maturity – when the bond term ends - (4.0% as at 31 Jan 2024), we get a synthetic price/earnings valuation of 25.0x. This compares well with the inflated valuation of nearly 200x seen when yields – which move inversely to bond prices - plunged below 1% during the growth shock of the global pandemic in 2020. And, while today’s US Treasury valuation is still slightly richer than the S&P 500 Index’s – a widely used US stock market benchmark - forward price/earnings ratio of 23.2x, it should be borne in mind that US Treasuries are virtually guaranteed to receive back their ‘100’ when they eventually mature, whereas equities of course provide no such assurance on return of capital over such a specific timeline.
Better value once more – US Treasuries are now offering more normal valuations:
Price/earnings from 31 Dec 2003 to 31 Jan 2024
Past performance is not an indicator of future performance and current or future trends.
Source: Bloomberg
Price/earnings takes forward price/earnings for S&P 500 Index and 100/current yield to maturity for 10-year US Treasury note.
Source: Bloomberg
Price/earnings takes forward price/earnings for S&P 500 Index and 100/current yield to maturity for 10-year US Treasury note.
Decent valuation is of course always welcome when exploring any investment case but there needs to be a catalyst to move the price up in the near-to-medium term. In the case of longer-dated US Treasury bonds, that catalyst could be disinflation in the US – as in a slowdown in the rate of price rises - which would pull down yields and raise the price of the bonds. From its 9.1% year-on-year peak as at end June 2022, US headline inflation (as measured in Consumer Price Index terms) has gradually eased off to the 3.4% year-on-year level as at the end of December 2023. If three datapoints make a trend then the 18 monthly inflation datapoints between the above dates (source: Bloomberg) give a reasonable assurance that inflation is gradually getting back towards the levels seen before the distortion of the global pandemic. Indeed, goods inflation is now much lower as supply chains have eased. While the jobs market remains tight, if we squint then tentative signs of loosening can be seen. Increases in the supply of available workers in the US have contributed to gradually softening wage growth, with average hourly wages up 4.1% on the previous year in December, compared with 5.0% at the end of 2021.
Subdued economic growth would be positive for bond prices
What about that other component of bond yields, economic growth expectations? An argument could be made that US economic growth has now peaked at a 4.9% annualised rate in the third quarter of 2023, driven in large part by the one-off factor of payments made by the US government to taxpayers during the pandemic. According to the Boston Federal Reserve (Fed), there are USD 340 billion of excess savings remaining in the hands of US consumers. Of course, this is a large amount but the Boston Fed believes it should be mostly spent by the second half of 2024, with the result that economic growth should eventually cool. Stepping (much) further back, historical data also shows a trend of gradually falling global growth rates over hundreds of years. Paul Schmelzing, in his seminal (but not very catchily titled) paper ‘Eight centuries of global real interest rates, R-G, and the ‘supra-secular’ decline, 1311–2018’ posits that a trend decline of 0.6-1.6 basis points in real interest rates (economic growth expectations) has been in evidence in world bond markets since the Middle Ages. Continuation of this trend is not merely lazy extrapolation. Profound secular forces, including wealth inequality, shrinking labour markets and climate change, look set to weigh heavily on the real rate (growth) component of bond yields. Taken together, the case for falling bond yields both from an inflation and growth perspective is robust.
Why multi-asset portfolios should always hold long-dated Treasuries
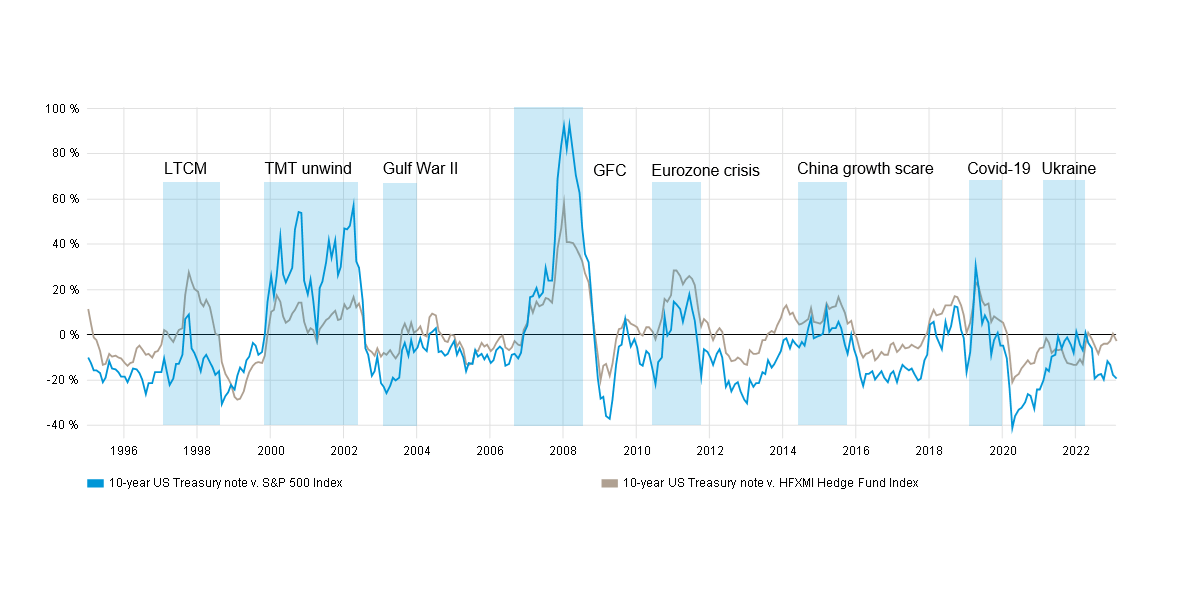
US Treasuries also offer a near-term benefit when constructing investment portfolios. Since the US has never defaulted on its Treasury notes (the non-payments of 1862, 1933, 1968 and 1971 technically covered other types of issuance), the full faith and credit guarantee has lent US government bonds the unique characteristic of nearly always holding their value during times of distress. This ‘crash protection’ is often a more reliable cushion in extremis than many other asset classes typically found in investor portfolios today. Stocks of course can be notoriously volatile amid uncertainty, and this is to be expected. But even investment grade (high quality) or high yield bonds (lower quality, entailing greater credit risk in return for higher yields) can be adversely affected by rising corporate default rates if economic growth cools, giving them an intrinsic correlation to stocks. Likewise alternative investments as a peer group (for example, the HFRX Global Hedge Fund Index) have exhibited an unfortunate tendency to mirror downward moves in wider stock markets over time. The reliable diversification properties of longer-dated US Treasuries mean that there should always be a place for them in multi-asset portfolios. This might not be as much as the 40% implied by the classic 60:40 investment portfolio – a traditional model favouring 60% invested in equities and the remaining 40% in bonds - but neither should it be nothing, especially given the opportunity outlined above.
In case of emergency…always hold US Treasuries:
1 year rolling relative returns from 31 Dec 1995 to 29 Jan 2024
Past performance is not an indicator of future performance and current or future trends.
Source: Thomson Reuters, RIMES, Hedge Fund Research
Source: Thomson Reuters, RIMES, Hedge Fund Research
As always with investments, risks to any scenario, including this one, do exist. For one thing, inflation in America might persist, and indeed, the latest 3.4% reading demonstrated just how hard the ‘final mile’ will be in the journey back to pre-pandemic yields. While goods prices as mentioned have eased, services have been persistently strong and even housing has shown price rises in 2023 amid shortages of single-family dwellings in the US. This could raise inflationary expectations once again. Furthermore, the Fed is selling bonds via quantitative tightening (QT) which has the effect of putting downward pressure on their prices (and upward pressure on yields) as supply increases. However, the supporting factors described previously offer something more profound. Better valuations in US Treasuries after several years give bondholders a certain cushion. And the post-pandemic trajectory of gradual disinflation rightly and inevitably reflects the end of a uniquely traumatic once-in-a-century episode. Additionally, the long-term history and super-secular forces described point to structurally low GDP growth which is inherently supportive of government bonds over time. Finally, the portfolio ‘airbag’ effect of US Treasuries remains undiminished as demonstrated during the traumas of the global pandemic and war in Ukraine. Taken together, this makes an asset class seen as traditionally dull more than a little interesting today. Being reincarnated as the bond market seems like a long shot but being exposed to it is far more practical.
Important disclosures and information
The information contained herein is given for information purposes only and does not qualify as investment advice. Opinions and assessments contained herein may change and reflect the point of view of GAM in the current economic environment. No liability shall be accepted for the accuracy and completeness of the information contained herein. Past performance is no indicator of current or future trends. The mentioned financial instruments are provided for illustrative purposes only and shall not be considered as a direct offering, investment recommendation or investment advice or an invitation to invest in any GAM product or strategy. Reference to a security is not a recommendation to buy or sell that security. The securities listed were selected from the universe of securities covered by the portfolio managers to assist the reader in better understanding the themes presented. The securities included are not necessarily held by any portfolio nor represent any recommendations by the portfolio managers nor a guarantee that objectives will be realised.
The S&P 500 Index is a broad-based stock market index that tracks the share prices of 500 of the largest public companies in the United States The HFRX Global Hedge Fund Index® is comprised of funds representing all the main hedge fund strategies. The underlying strategies are asset-weighted according to the distribution of assets across the hedge fund industry. References to indexes and benchmarks are hypothetical illustrations of aggregate returns and do not reflect the performance of any actual investment. Investors cannot invest in indices which do not reflect the deduction of the investment manager’s fees or other trading expenses. Such indices are provided for illustrative purposes only. Indices are unmanaged and do not incur management fees, transaction costs or other expenses associated with an investment strategy. Therefore, comparisons to indices have limitations. There can be no assurance that a portfolio will match or outperform any particular index or benchmark.
This article contains forward-looking statements relating to the objectives, opportunities, and the future performance of markets generally. Forward-looking statements may be identified by the use of such words as; “believe,” “expect,” “anticipate,” “should,” “planned,” “estimated,” “potential” and other similar terms. Examples of forward-looking statements include, but are not limited to, estimates with respect to financial condition, results of operations, and success or lack of success of any particular investment strategy. All are subject to various factors, including, but not limited to general and local economic conditions, changing levels of competition within certain industries and markets, changes in interest rates, changes in legislation or regulation, and other economic, competitive, governmental, regulatory and technological factors affecting a portfolio’s operations that could cause actual results to differ materially from projected results. Such statements are forward-looking in nature and involve a number of known and unknown risks, uncertainties and other factors, and accordingly, actual results may differ materially from those reflected or contemplated in such forward-looking statements. Prospective investors are cautioned not to place undue reliance on any forward-looking statements or examples. None of GAM or any of its affiliates or principals nor any other individual or entity assumes any obligation to update any forward-looking statements as a result of new information, subsequent events or any other circumstances. All statements made herein speak only as of the date that they were made.