Wednesday, August 2, 2017
GAM Holding AG H1 2017 underlying pre-tax profit CHF 75.4 million
- Underlying profit before taxes rose 37% from H1 2016 to CHF 75.4 million; diluted underlying EPS up 37% to CHF 0.37 (CHF 0.27 in H1 2016)
- IFRS net profit up 27% to CHF 67.7 million; diluted IFRS EPS of CHF 0.43 (CHF 0.34 in H1 2016)
- Net fee and commission income up 11% to CHF 257.7 million
- Group assets under management up 9% to CHF 131.3 billion from CHF 120.7 billion at 31 December 2016
- Investment management:
- Net inflows of CHF 1.9 billion, with specialist fixed income strategies driving inflows
- Assets under management up 6% to CHF 72.2 billion from CHF 68.2 billion at 31 December 2016 as a result of net inflows and a net positive impact from investment performance and foreign exchange movements
- Private labelling:
- Net inflows of CHF 4.5 billion
- Assets under management up 13% to CHF 59.1 billion from CHF 52.5 billion at 31 December 2016, driven by net inflows and a net positive impact from market and foreign exchange movements
Group CEO Alexander S. Friedman said: “Our financial results are beginning to reflect all our work to implement a turnaround at GAM. The steps we have taken over the past two years are showing tangible results, and the outlook gives us confidence in the future performance of the business.
Our net inflows were strong in the first half of this year, the investment performance of the majority of our assets under management was excellent, a number of our key investment strategies delivered good performance fees, and our profitability improved substantially compared with the first half of 2016. We are well underway in positioning GAM for long-term growth, and our focus on disciplined execution of our strategy and operating efficiency is unrelenting.”
Group results H1 2017
The underlying pre-tax profit rose 37% to CHF 75.4 million compared with the first half of 2016 as costs continued to be managed tightly and net fee and commission income increased.
The underlying effective tax rate decreased to 22.1% from 23.3%, mainly reflecting the geographical split of earnings. Diluted underlying earnings per share rose 37% to CHF 0.37 from CHF 0.27 as a result of a 39% increase in the underlying net profit.
The IFRS net profit rose 27% to CHF 67.7 million. The IFRS figure includes two items that are not reflected in the underlying results: non-recurring items that resulted in a net loss of CHF 7.3 million and acquisition-related items that resulted in a net gain of CHF 16.3 million. The former include the impairment of investment management and client contracts, reorganisation charges, and deal and integration costs related to the acquisitions completed in the second half of 2016. Acquisition-related items include a reduction in the estimate of the deferred consideration liability for the acquisitions of Arkos (now GAM Lugano), THS and Cantab, partly offset by the amortisation of investment management and client contracts from businesses acquired and finance charges on the deferred consideration liabilities.
Net fee and commission income increased 11% to CHF 257.7 million. Net management fees and commissions increased 3% to CHF 238.4 million, driven by higher average assets under management, while the management fee margin in investment management was flat compared with the first half of 2016 and slightly decreased in private labelling. Performance fees rose to CHF 19.3 million from CHF 1.2 million in the first half of 2016, with the unconstrained/absolute return bond strategy and other fixed-income strategies contributing the majority of these fees.
Personnel expenses of CHF 125.7 million were largely flat compared with the first half of 2016. Fixed personnel costs were 6% lower as a result of a reduction in staff levels from 1,024 at 30 June 2016 to 937 full-time equivalents at 30 June 2017 (including additional headcount from the acquisitions of THS and Cantab). Variable compensation rose 11% compared with the first half of 2016, mainly due to higher performance fee-related bonuses. The compensation ratio decreased to 48.8% from 53.7%, reflecting the increase in net fee and commission income with personnel expenses remaining flat.
General expenses increased 5% to CHF 53.2 million compared with the first half of 2016. Administration expenses, reflecting fees paid to State Street for the outsourced back and middle office services, increased from CHF 1.7 million to CHF 4.1 million. These fees were recognised for the first time in March 2016, while in 2017 they are included for the entire period.
Investment management assets and flows
Strong performance of GAM’s investment strategies and strengthened sales capabilities translated into improved net inflows of CHF 1.9 billion, which represent an annualised growth rate of 5.6% on assets under management as at 31 December 2016. Positive investment performance was only partly offset by the negative impact from foreign exchange movements, further boosting assets under management by a net CHF 2.1 billion. As a result, investment management assets rose to CHF 72.2 billion at the end of June 2017 from CHF 68.2 billion at the end of 2016.
Assets under management movements (CHF bn)
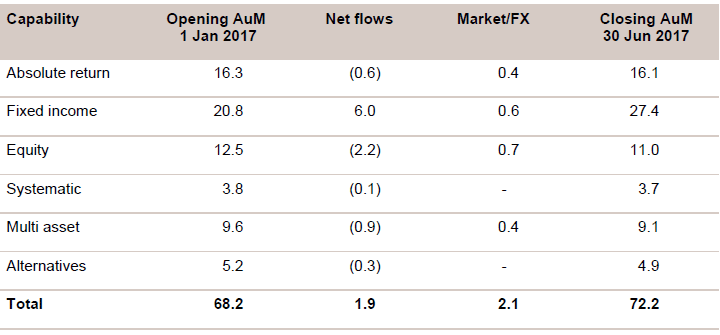
Net flows by capability
The unconstrained/absolute return bond strategy experienced good inflows in the period, and the GAM Star (Lux) – Merger Arbitrage fund, which celebrated its one-year anniversary in July 2017, continued to attract investor demand. The GAM Absolute Return Europe Equity fund, which takes long and short positions in equities and equity-related securities of European companies, and the GAM Star Global Rates fund saw redemptions following a period of weaker performance in 2016. Overall, investors withdrew net CHF 0.6 billion from absolute return strategies.
In fixed income, net inflows totalled CHF 6.0 billion. The GAM Star Credit Opportunities strategy, which predominantly invests in investment grade debt or high quality issuers, the GAM Local Emerging Bond fund, which invests in debt of emerging countries denominated or pegged to the respective local currency, as well as the GAM Star MBS Total Return fund all attracted strong inflows.
In equity, net outflows of CHF 2.2 billion reflected redemptions from global equity mandates and a number of regional strategies, while the GAM Star Continental European Equity fund continued to attract solid net inflows.
In systematic strategies, net inflows into the GAM Systematic Alternative Risk Premia strategy were offset by some clients rebalancing away from systematic products, resulting in net outflows of CHF 0.1 billion.
Multi asset strategies experienced net outflows of CHF 0.9 billion for the period, reflecting redemptions in private client advisory stemming from previous affiliations with UBS and Julius Baer as well as some institutional mandates.
Net outflows of CHF 0.3 billion in alternatives largely reflected redemptions in the fund of hedge funds business, while commodity strategies recorded some modest inflows.
Net flows by client segment
The Group recorded strong inflows through financial intermediaries, with clients adding net CHF 2.3 billion in the first half of 2017. Institutional clients added net CHF 0.3 billion in the period, while net outflows from private clients of CHF 0.7 billion largely reflect redemptions as explained in the multi asset section above.
Investment performance
Over the five-year period to 30 June 2017, 72% of assets under management in funds outperformed their respective benchmark, compared with 68% that outperformed over five years to 31 December 2016. Over the three-year period to 30 June 2017, 71% of assets under management in funds outperformed their respective benchmark, up from 60% that outperformed over three years to 31 December 2016.
Private labelling assets and flows
Assets under management movements (CHF bn)
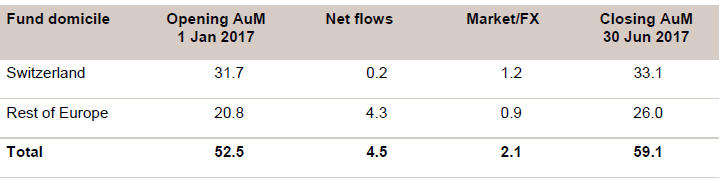
Assets under management in private labelling, which provides fund solutions for third parties, rose to CHF 59.1 billion as at 30 June 2017 from CHF 52.5 billion at the end of 2016. Net inflows amounted to CHF 4.5 billion, while market and foreign exchange movements added a net CHF 2.1 billion in assets.
Liquidity and tangible equity
The Group’s cash and cash equivalents amounted to CHF 281.2 million, down from CHF 352.7 million at the end of 2016, mainly reflecting the impact of the dividend payment for the 2016 financial year (CHF 102.2 million) and bonus payments for 2016. These effects were partly offset by cash flows generated from operating activities and some seed capital redemptions.
Tangible equity amounted to CHF 108.9 million, compared with CHF 107.4 million at the end of 2016. The main contributors to this slight increase were the underlying net profit, the impact from the adjustments to the deferred consideration liabilities, and the remeasurement of pension liabilities. These effects were almost fully offset by the dividend payment for the 2016 financial year and share purchases to cover the Group’s obligations under share-based compensation plans.
Update on strategic initiatives
Investment performance
Investment performance improved in 2017 in many key investment strategies, with the specialist fixed income and absolute return capabilities doing particularly well. In equities, GAM hired Matthew Beesley, former head of global equities at Henderson, to a new role as head of equities to work together with the various equity teams to optimise performance and risk management and to ensure strong links with the distribution teams. He joined GAM in March 2017.
The company is introducing a number of changes to build a truly unified equities business that can deliver significant growth. Each investment team continues to have investment autonomy to meet its clients’ needs. At the same time, the teams will leverage a common infrastructure and share internally generated research and insights more efficiently, all to support the generation of superior investment performance.
Differentiated product offering
The Group continues to develop innovative products to meet clients’ needs and has a strong organic pipeline of product launches for the second half of this year, spanning equity income, insurance-linked securities and a number of systematic strategies.
GAM is also further tailoring its product offering regionally. It recently launched three existing strategies in the form of UK Open Ended Investment Companies in response to demand from financial intermediaries and advisers, and an Australian-domiciled fund for GAM Systematic Alternative Risk Premia for the Australian superannuation sector.
The company continues to simplify its product range to concentrate on the most promising and scalable strategies. In the first half of 2017, it merged or closed six funds in addition to 66 funds in the previous two years, with a de minimis loss of assets under management.
Global distribution
The Group has made good progress in upgrading its distribution capabilities under the leadership of Tim Rainsford, who joined GAM as group head of sales and distribution on 1 January 2017. This includes the creation of a new team to cover global consultants, new sales leadership in the UK and in Asia Pacific, and a new head of institutional sales for the Middle East. The company expanded its distribution presence in continental Europe to gain better traction with clients by opening offices in Vienna and Paris. In addition, it hired a new global head of marketing, who started in July.
GAM achieved the final step to reduce brand complexity through an agreement with Julius Baer to terminate its licence to use the Julius Baer trademarks. The funds formerly bearing the trademarks were successfully rebranded in early July 2017, while ensuring that clients are fully aware that their portfolio managers, strategies and investment processes remain unchanged.
Operating efficiency
The Group’s multi-year change programme to deliver significant operating efficiencies is progressing well. This extensive programme involves a variety of projects, including the implementation of single data architecture, a move to cloud-based IT infrastructure, simplification of systems, processes and reporting, outsourcing of back and middle office activities, creation of centres of excellence, premises simplification and legal entity rationalisation.
Cost discipline remains a key priority for the Group as it realises efficiencies in a controlled and appropriately sequenced manner, while meeting clients’ needs and regulatory obligations. GAM is on track to deliver annual cost savings of CHF 10 million in 2017 and at least CHF 30 million by 2019 compared with 2016, excluding the impact from previous acquisitions.
Outlook
Improved investment performance and strengthened distribution capabilities should help drive future flows. In addition, the current market environment, with growing dispersion between asset classes and greater importance of fundamentals, is supportive for active asset managers like GAM.
The Group is committed to increasing diluted underlying earnings per share in excess of 10% on an annualised basis and achieving an operating margin of 35–40%, both over the five to eight-year business cycle.
Finally, as communicated in April 2017, the Board of Directors is conducting a comprehensive review of the Group’s compensation structures and policies, in consultation with shareholders. The Board is fully committed to ensuring alignment of remuneration with the long-term success of the business.
The presentation for media, analysts and investors on the results of GAM Holding AG for the first half of 2017 will be webcast on 3 August 2017 at 9:00am (CET). Materials relating to the results (presentation slides, half-year report 2017 and press release) are available at www.gam.com.
Forthcoming events:
19 October 2017 Interim management statement Q3 2017
1 March 2018 Full-year results 2017
19 April 2018 Interim management statement Q1 2018
26 April 2018 Annual General Meeting
For more information please contact:
Media Relations:
Elena Logutenkova
+41 (0) 58 426 63 41
Investor Relations:
Patrick Zuppiger
+41 (0) 58 426 31 36
Follow us on: Twitter and LinkedIn
About GAM
GAM is one of the world’s leading independent, pure-play asset managers. The company provides active investment solutions and products for institutions, financial intermediaries and private investors. The core investment business is complemented by private labelling services, which include management company and other support services to third-party asset managers. GAM employs over 900 people in 13 countries with investment centres in London, Cambridge, Zurich, Hong Kong, New York, Milan and Lugano. The investment managers are supported by an extensive global distribution network.
Headquartered in Zurich, GAM is listed on the SIX Swiss Exchange and is a component of the Swiss Market Index Mid (SMIM) with the symbol ‘GAM’. The Group has assets under management of CHF 131.3 billion (USD 137.1 billion) as at 30 June 2017.
Disclaimer regarding forward-looking statements
This press release by GAM Holding AG (‘the Company’) includes forward-looking statements that reflect the Company’s intentions, beliefs or current expectations and projections about the Company’s future results of operations, financial condition, liquidity, performance, prospects, strategies, opportunities and the industry in which it operates. Forward-looking statements involve all matters that are not historical facts. The Company has tried to identify those forward-looking statements by using words such as ‘may’, ‘will’, ‘would’, ‘should’, ‘expect’, ‘intend’, ‘estimate’, ‘anticipate’, ‘project’, ‘believe’, ‘seek’, ‘plan’, ‘predict’, ‘continue’ and similar expressions. Such statements are made on the basis of assumptions and expectations which, although the Company believes them to be reasonable at this time, may prove to be erroneous.
These forward-looking statements are subject to risks, uncertainties, assumptions and other factors that could cause the Company’s actual results of operations, financial condition, liquidity, performance, prospects or opportunities, as well as those of the markets it serves or intends to serve, to differ materially from those expressed in, or suggested by, these forward-looking statements. Important factors that could cause those differences include, but are not limited to: changing business or other market conditions, legislative, fiscal and regulatory developments, general economic conditions, and the Company’s ability to respond to trends in the financial services industry. Additional factors could cause actual results, performance or achievements to differ materially. The Company expressly disclaims any obligation or undertaking to release any update of, or revisions to, any forward-looking statements in this press release and any change in the Company’s expectations or any change in events, conditions or circumstances on which these forward-looking statements are based, except as required by applicable law or regulation.